Monitor your data with observe
This article helps you:
Understand how the Observe feature helps you better manage your event data for accuracy
Learn how to overlay your tracking plan with events from different environments
Update event statuses and correct properties based on Observe's insights
A big challenge for data, product, and growth teams is a lack of visibility into the state of their data collection. Often, teams rely on manual testing, broken charts, and personal instincts to validate their product analytics.
With no way to enforce or verify their event tracking, downstream systems are polluted with missing properties, wrong data types, incorrect naming conventions and more, resulting in poor quality data. This often results in a lack of confidence in the analytics, accumulated technical debt, and tons of hours wasted on cleaning and preparing data for analysis.
Amplitude Data’s Observe feature lets you inspect, analyze, and monitor your event tracking continuously. There are no code changes to make. You don’t even have to switch anything on. Observe runs automatically in the background, surfacing any issues with your data as they occur and making sure your code is always in sync with your tracking plan.
Observe listens in on your existing event stream and turns your tracking code into a living document, so you can get a holistic view of the state of your data collection across your platforms.
You and your teams will get immediate insight into anything that's broken or needs attention. With an intuitive and collaborative workflow, your teams can work together to instrument fixes and get your tracking plan in shape.
View and update your event statuses
To access your event stream, go to Data > Events. This displays all your events.
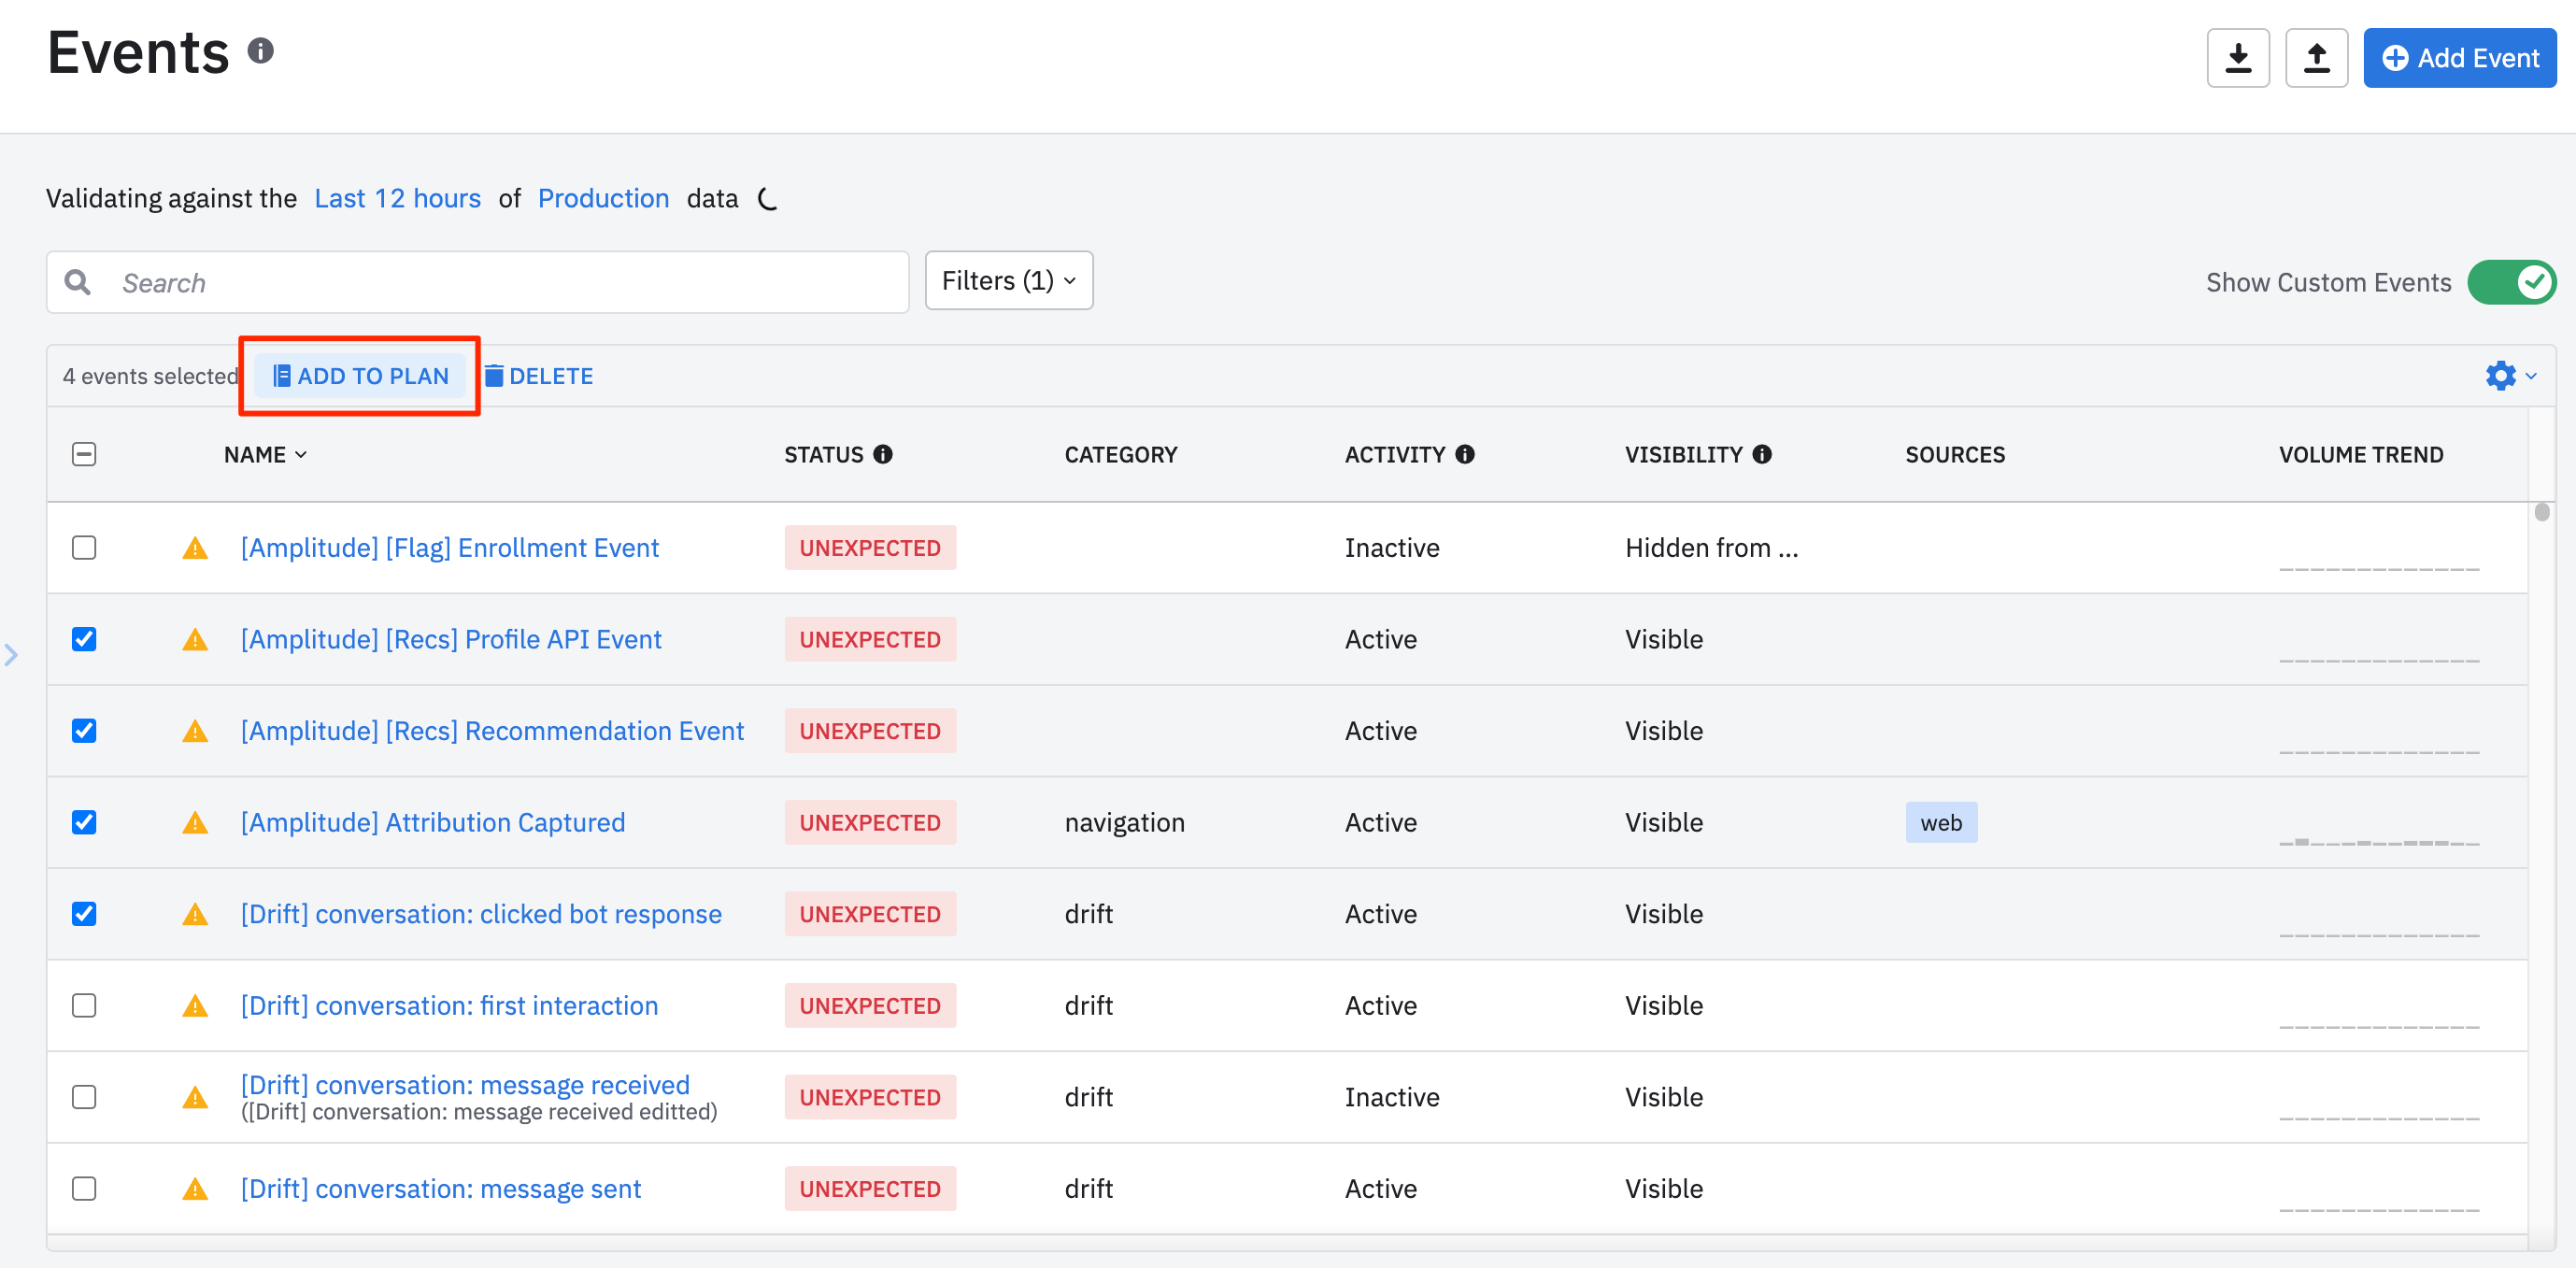
The first time you view your tracking plan, all events and properties received and processed by Amplitude are displayed. By default, all events and properties are categorized as Unexpected. To add them to your tracking plan, check the box next to the event name and click Add to plan.

Do this anytime you want to add an unexpected event to your tracking plan. Click Publish to complete the process. From now on, Observe alerts you about any changes to this event or any properties associated with it.
Your events will always have one of four statuses:
- Unexpected: Any event or property that is not yet added to your tracking plan.
- Valid (and Current): Any event or property that matches (in name and schema) the latest version of an existing event. If Observe doesn’t know the version of the event, it only ensures that the event shape matches your current tracking plan.
- Invalid: Any event or property that doesn’t match your current tracking plan.
- Out of Date: Any event or property that matches a previous version of an existing event or property (only applicable when using Amplitude SDKs).
Remember, Observe only surfaces the data as it occurs. If you have legacy tracking or events that fire infrequently, they may not appear in your tracking plan. If you know of any events that aren’t surfaced by Observe, you can add them manually to your plan, or trigger the events yourself.
Note
Observe and the Ampli CLI
If you’ve instrumented all your event tracking using Amplitude’s SDKs, you already benefit from type-safe analytics libraries, client-side validation, and continuous integration (CI) for clean and accurate data you can trust.
Observe will still add value by surfacing and alerting you to any runtime validation errors in the web app. This is specifically relevant for JavaScript, as it’s not a type-safe language, and checks are only performed at runtime. See the Amplitude Data developer documentation for more details.
Overlay your tracking plan with observed events and issues
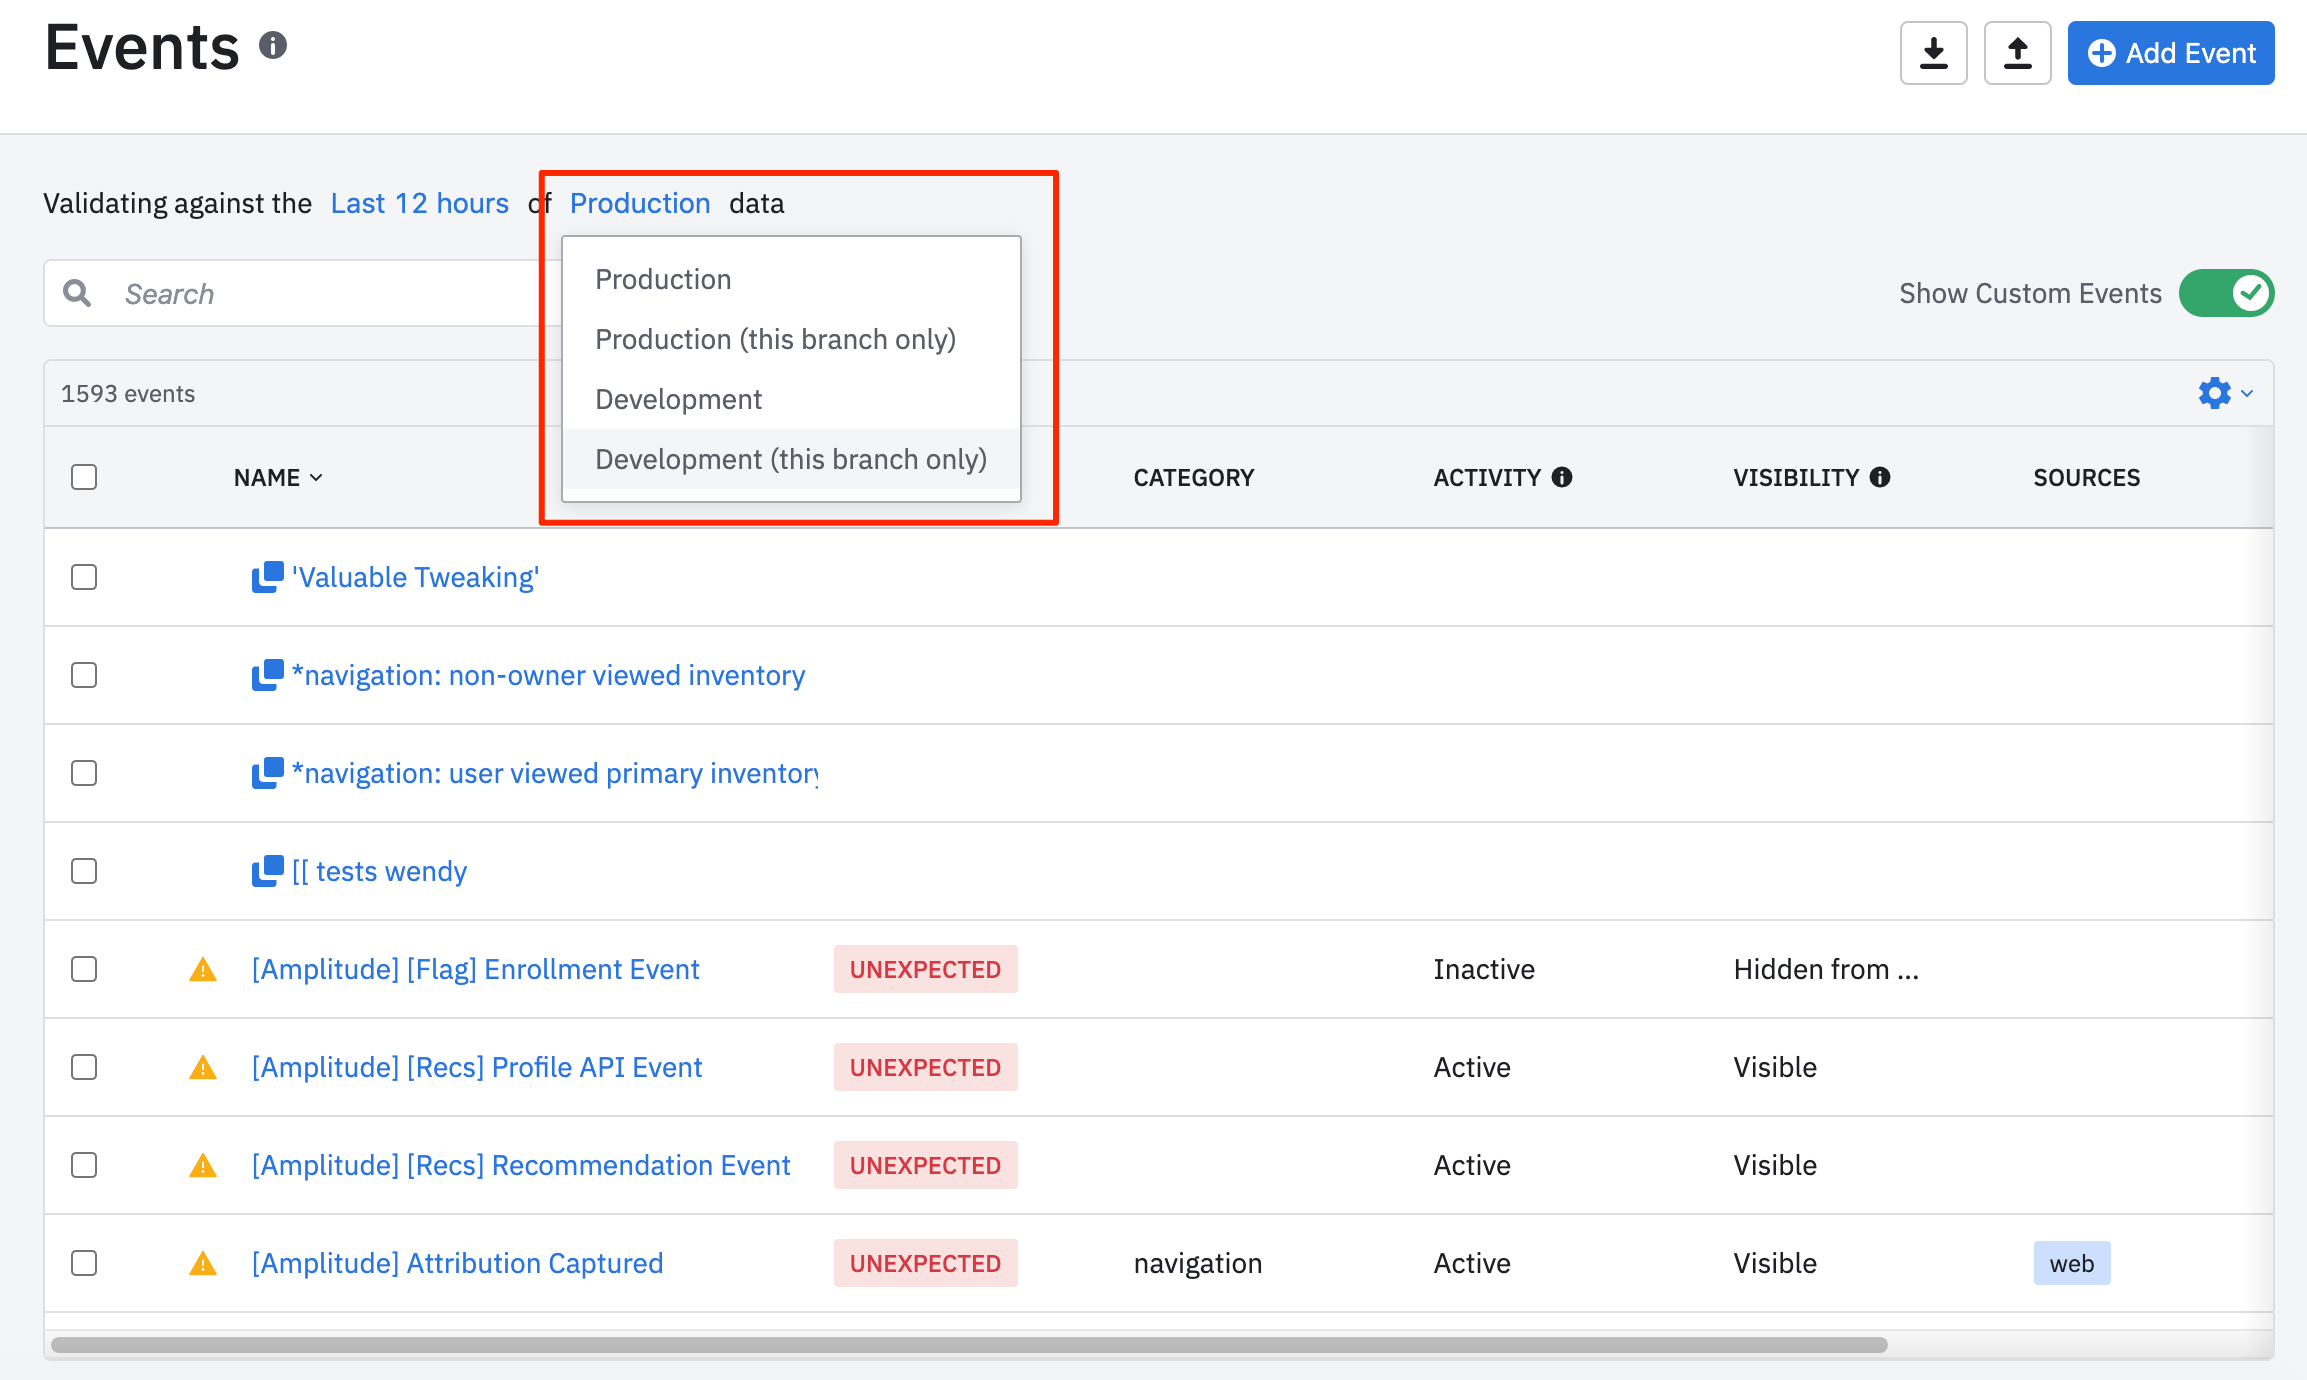
You can overlay your tracking plan with your event stream.

If you’re using the Amplitude SDK, you also have the option to overlay your tracking plan with your event stream from an environment, but only data sent to the specific branch you’re currently on. This is useful for debugging when you have multiple teams sending data to the environment.
You can also set a specific time range to use for overlaying your event stream with your tracking plan. You can choose from:
- Five minutes
- One hour
- 12 hours
- Seven days
- 14 days
Bear in mind that changing this range can determine whether Observe considers an event to be valid or invalid. For example, if you had a bug seven days ago, choosing the Last 7 days will cause the event to show up as invalid. However, if you changed it at any point between seven days ago and 12 hours ago, and then choose Last 12 hours, Observe will consider it valid.
Act on your Observe insights
Observe will surface missing and invalid properties on an event. The property rows show this information in a few different ways:
- Status tooltip: Indicates if an event was invalid at the point it was received (if Observe receives the version, it compares the event to the version; otherwise, it compares the event to your current tracking plan).
- % Seen indicator: Will be red if the property is currently (published or unpublished) required and the event was received without the property within the selected timeframe. The indicator could be red while the status is green if you have unpublished changes, or if the event was recently modified.
- Type indicator: Will be red if the property was received with a type other than what is currently selected (published or unpublished) within the selected timeframe. The indicator could be red while the status is green if you have unpublished changes, or if the event was recently modified.
Observe will also automatically detect the source of each event (based on the library) and display those sources in the event detail pane. This is especially helpful when you have multiple sources managed by different teams, as you'll be able to identify which source is sending invalid data.
The sparkline to the right of the source name will show both total and invalid event volume to quantify the amount of data seen with errors.
You can also create and assign multiple SDK sources with the same library. For example, if you have a marketing site and a web app that use the Browser SDK, you can create two different sources and assign the correct source to each event. Using Ampli will also let you see each source's volume and validation data separately. If you're not using Ampli, you'll see the volume for both sources rolled up into a single row with the library name (in this case, "Browser SDK".)
Scope and limitations
Observe will work out of the box if you’re sending data to Amplitude. Observe is limited by how you’re currently sending data to Amplitude. If you’re using Amplitude’s SDKs (current source support: JavaScript, Node.js, Android and iOS), Observe is able to attribute your event stream to its respective source (web, iOS, backend, etc.).
Note
August 5th, 2024
Need help? Contact Support
Visit Amplitude.com
Have a look at the Amplitude Blog
Learn more at Amplitude Academy
© 2026 Amplitude, Inc. All rights reserved. Amplitude is a registered trademark of Amplitude, Inc.